-
Start of How to Design A Course with Video Using Two Important Frameworks blog post description
![Learner working through online course.]()
How to Design A Course with Video Using Two Important Frameworks
Successful course design helps employees and learners acquire the knowledge and skills needed in their careers. Learning how to... End of How to Design A Course with Video Using Two Important Frameworks blog post description
-
Start of Employee Engagement: Your 2024 Guide to Best Practices (Plus Video Tips That Work) blog post description
![Group of employees high fiving each other in office.]()
Employee Engagement: Your 2024 Guide to Best Practices (Plus Video Tips That Work)
Bad news for companies battling workplace burnout, high turnover, and plummeting productivity. According to this employee... End of Employee Engagement: Your 2024 Guide to Best Practices (Plus Video Tips That Work) blog post description
-
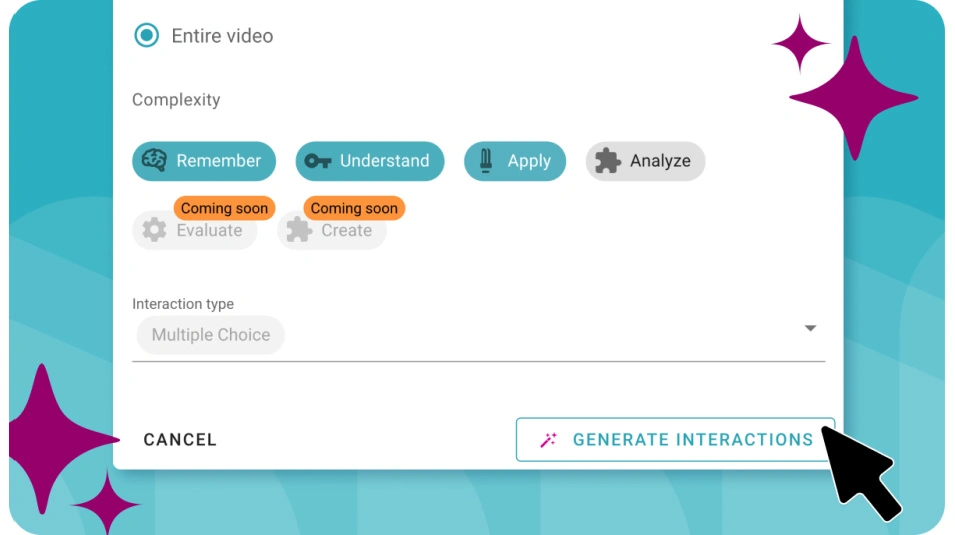
Start of Save Time Lesson Planning with AI Interactions blog post description
![AI Interactions feature in WeVideo Interactivity.]()
Save Time Lesson Planning with AI Interactions
We're excited to announce the launch of AI Interactions, our new AI-driven tool available in WeVideo Interactivity! With AI... End of Save Time Lesson Planning with AI Interactions blog post description
-
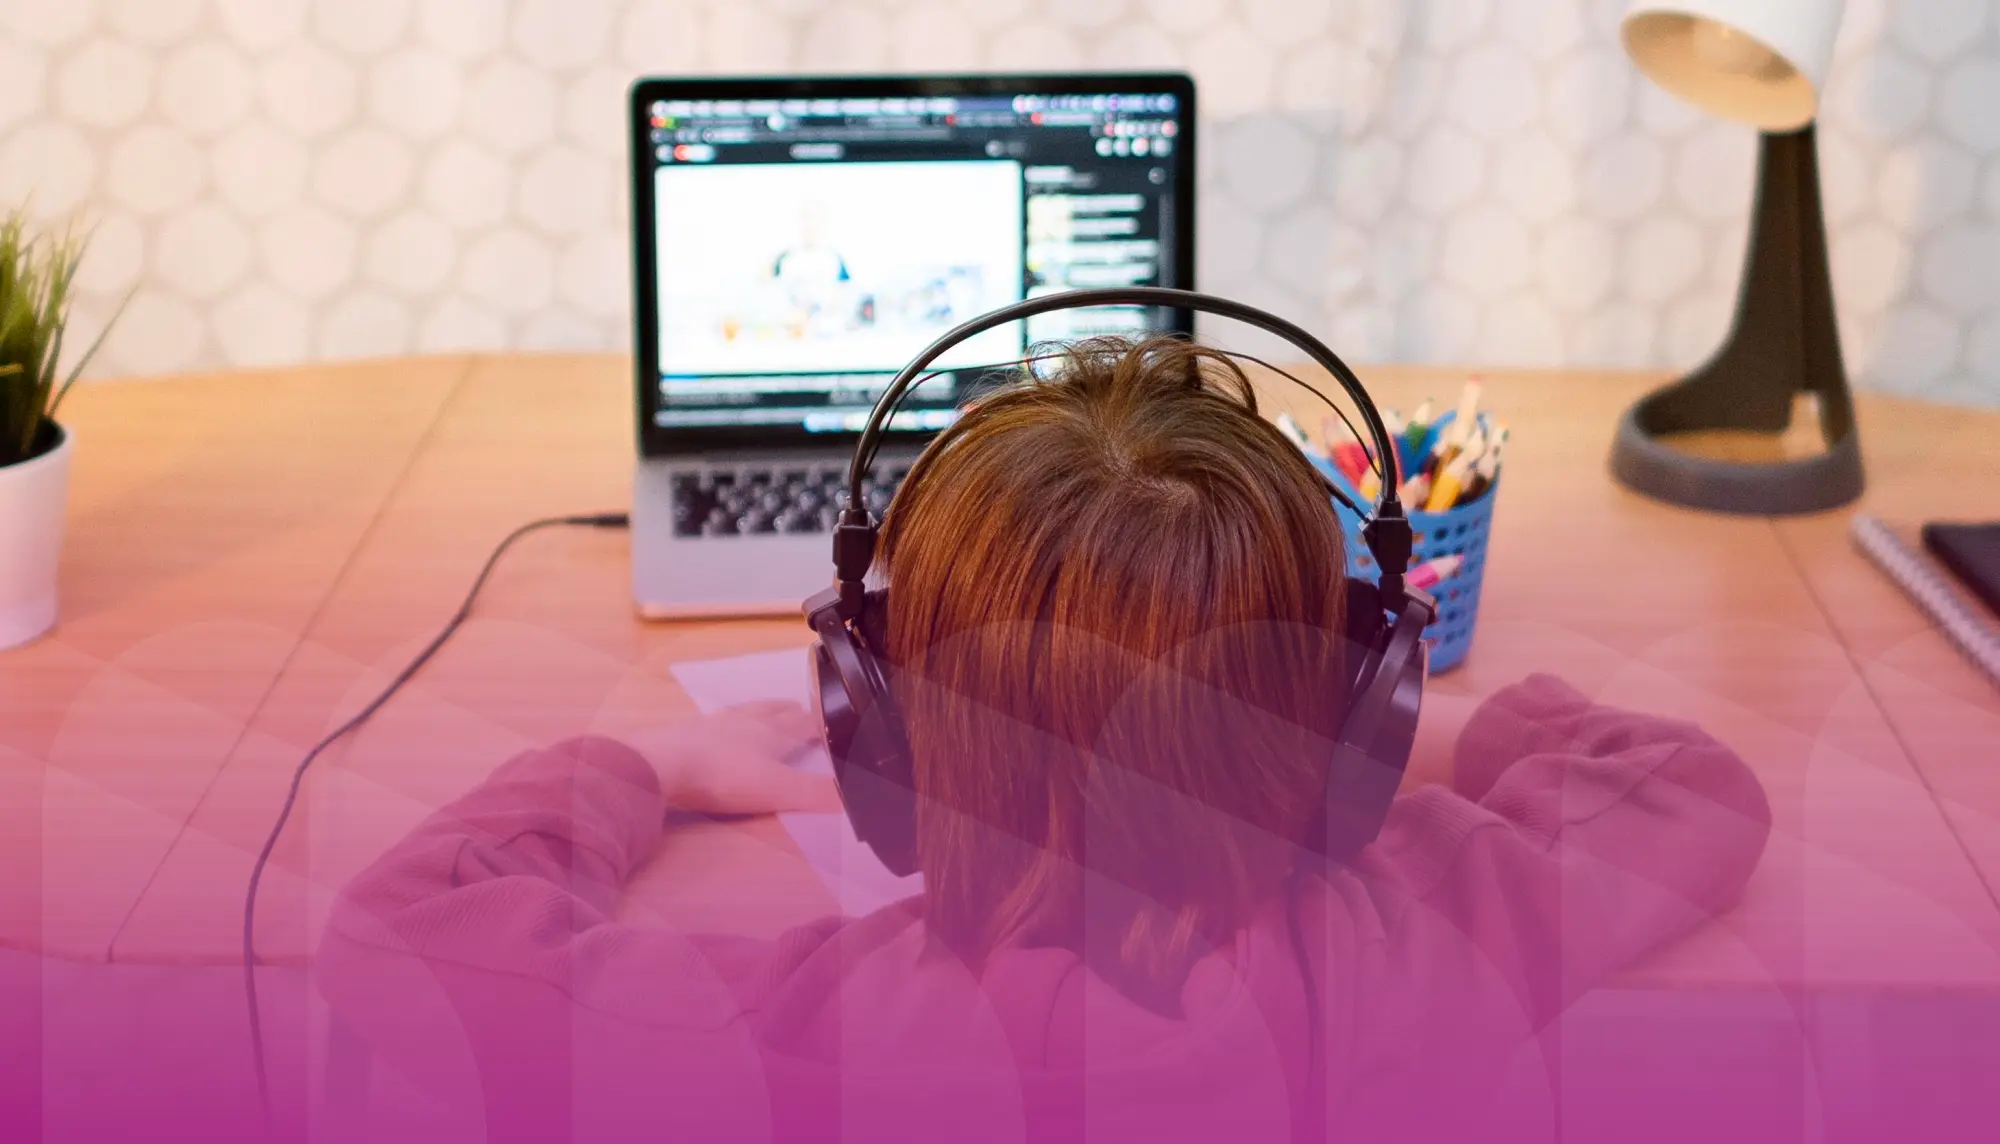
Start of Mastering Bloom's Taxonomy with Video Learning: An Educator's Guide blog post description
![Young student working on computer from home. Blue filter on top of image.]()
Mastering Bloom's Taxonomy with Video Learning: An Educator's Guide
For almost seventy years, teachers have used Bloom's Taxonomy in classrooms to guide learning, structure lessons, and assess... End of Mastering Bloom's Taxonomy with Video Learning: An Educator's Guide blog post description
-
Start of How to Use Video to Improve Employee Training blog post description
![Employee training taking place in office. Yellow filter on top of image.]()
How to Use Video to Improve Employee Training
Employee training keeps team members on the same page and gives them the information they need to do good work. However, the... End of How to Use Video to Improve Employee Training blog post description
-
Start of How Students' Brains Are Wired for Digital Storytelling (Plus 4 Projects to Try ) blog post description
![Students participating in digital storytelling activity on laptop. Orange filter on top of image.]()
How Students' Brains Are Wired for Digital Storytelling (Plus 4 Projects to Try )
Think of an example of great storytelling. Maybe a favorite book, podcast, or episode of a show on Netflix pops into your head.... End of How Students' Brains Are Wired for Digital Storytelling (Plus 4 Projects to Try ) blog post description
-
Start of Empowering Voice and Choice Through Multimedia Creation blog post description
![Student recording podcast. Yellow filter on top of image.]()
Empowering Voice and Choice Through Multimedia Creation
Do all student projects need to be the same? If students are given the opportunity to select how they present a project, won’t... End of Empowering Voice and Choice Through Multimedia Creation blog post description
-
Start of Why Educators Are Turning to Self-Paced Learning in the Classroom blog post description
![Young boy engaged in self-paced learning on computer. Magenta filter on top of image.]()
Why Educators Are Turning to Self-Paced Learning in the Classroom
In recent years, self-paced learning has taken education by storm. With many schools and districts going one-to-one with student... End of Why Educators Are Turning to Self-Paced Learning in the Classroom blog post description
-
Start of How Interactive Video Enhances New Employee Orientation in 2024 blog post description
![Employee completing new employee orientation on computer. Teal filter on top of image.]()
How Interactive Video Enhances New Employee Orientation in 2024
New employee orientation aims to onboard new hires and help them assimilate into the company culture. A growing remote workforce... End of How Interactive Video Enhances New Employee Orientation in 2024 blog post description
-
Start of eLearning Tools: 7 Tools to Boost Engagement and Growth blog post description
![Student using eLearning tools on laptop. Teal filter.]()
eLearning Tools: 7 Tools to Boost Engagement and Growth
Learning doesn’t only happen with students sitting at desks in traditional brick-and-mortar classrooms. Online learning, or... End of eLearning Tools: 7 Tools to Boost Engagement and Growth blog post description
-
Start of Employee Training Videos: Tips & FAQs blog post description
![Employees watching an employee training video.]()
Employee Training Videos: Tips & FAQs
In decades past, just having employee training videos was enough to put any company ahead of the curve. Gone were the all-hands... End of Employee Training Videos: Tips & FAQs blog post description
-
Start of 8 Powerful Interactive Video Examples Turn Viewers Into Participants blog post description
![Interactive video example.]()
8 Powerful Interactive Video Examples Turn Viewers Into Participants
Interactive videos provide powerful results: 66 percent more engagement and a 44 percent longer viewing time compared with... End of 8 Powerful Interactive Video Examples Turn Viewers Into Participants blog post description